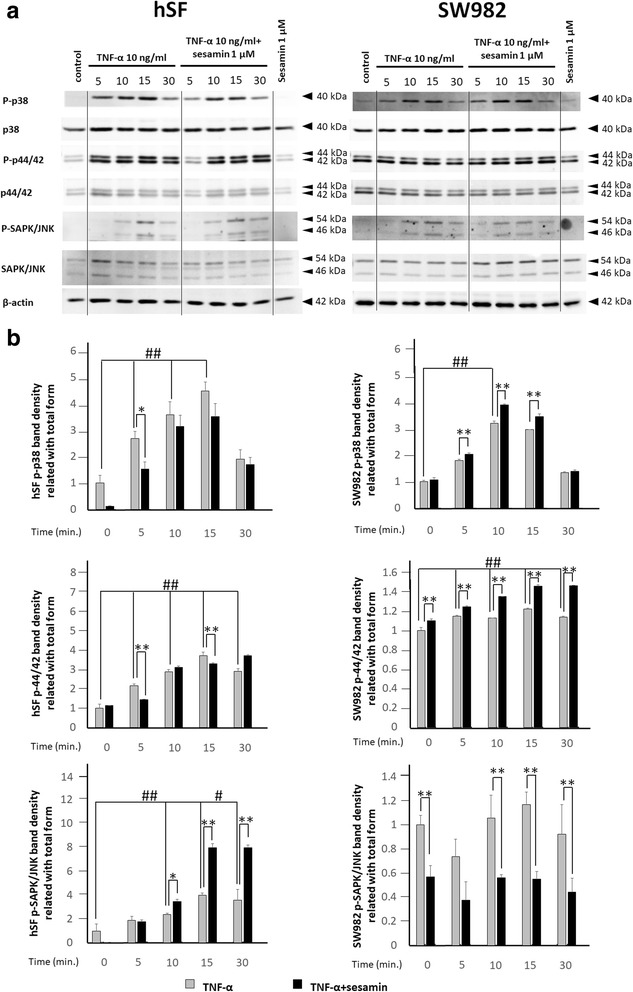
Fig. 5.

Western blot analysis of MAPK signal transduction in hSF and SW982 cells. MAPK signalling was observed at 0, 5, 10, 15 and 30 min after the addition of TNF-α 10 ng/ml to hSF or SW982 cells pre-treated with 1 μM sesamin as described in the Materials and Methods section. a Western blot results of MAPK signalling in hSF (left panel) and SW982 (right panel) cells under TNF-α-induced conditions with or without sesamin treatment. b Graphs of phosphorylation band densities of p38, p44/42 (ERK) and SAPK/JNK relative to the total form in hSF (left panel) and SW982 (right panel) cells. Values are presented as the mean ± SEM (n = 3). #, * = p < 0.05; ##, ** = p < 0.01 versus control 0 min (#) or TNF-α treatment at various time points (*) by one-way ANOVA
