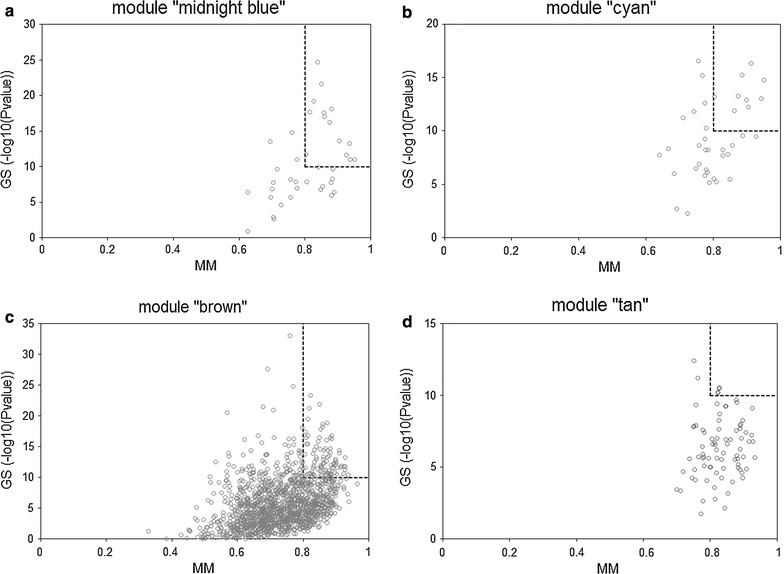
Fig. 4.

Scatterplots of the intramodular analysis results and hub genes identified in the four sepsis-associated modules. a Scatterplot for module “midnight blue”. b Scatterplot for module “cyan”. c Scatterplot for module “brown”. d Scatterplot for module “tan”. GS gene significance, MM module membership
