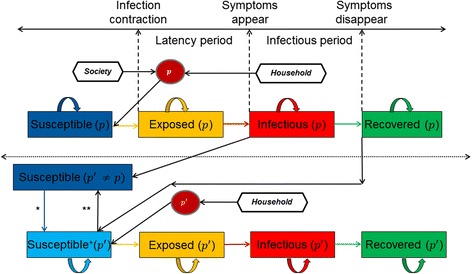
Fig. 1.

Graphical illustration of Susceptible, Exposed, Infectious, and Recovered states of the agent based model with some assumptions described. The time lines for the latency period and infectious period are also indicated through the dashed lines for an ith individual in the population for pathogens p and p', where p' ≠ p. The dependency assumption induces the Susceptible + state. The black arrows represent the influence direction, whereas the coloured arrows represent the transitions. The part above the dotted line indicates the states when only one pathogen is present in society, or when the pathogens are independently functioning in the system. The part below the dotted line is introduced when more than one pathogen is present in society and the pathogens interfere in the joint behaviour. *When an individual is Infectious for pathogen p and is still susceptible for another pathogen p ' it instantaneously moves to the state Susceptible + for pathogen p ' .** Once the individual is at the recovered state for pathogen p and is still at state Susceptible + for pathogen p ' it switches back to Susceptible state instantaneously
