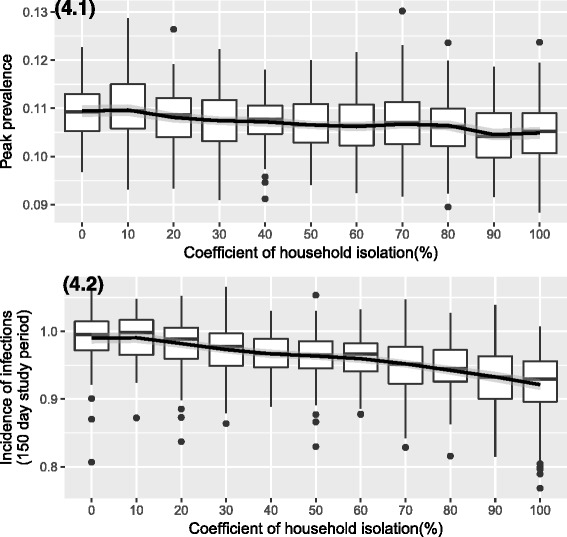
Fig. 4.

Epidemic outcomes with varying degree of household isolation. We observe a decrease in peak prevalence (4.1), and incidence of infections (numbers above 1 indicate that cumulative probability of infections during the study period was above 100%) (4.2), with the increase in the degree of household isolation during the infectious phase
