
Fig. 4.
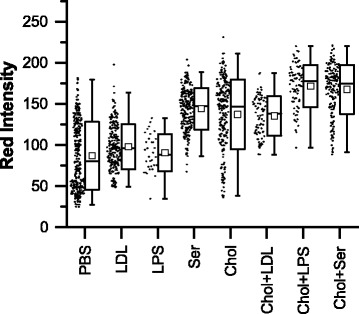
Summary of red intensity data for control samples and samples with cholesterol. Each point represents the average Nile Red fluorescence (i.e. red intensity normalized to maximum pixel intensity across all images) for one cell. In the box-and-whisker representation, the whiskers show the 1-99 percentiles, the box shows the standard deviation, the clear square shows the mean and the horizontal line shows the median. In all cases, the cholesterol condition had significantly (p < 0.001) increased red intensity compared with the paired control (i.e. Chol vs PBS or Chol + LDL vs LDL). Chol (cholesterol and 1-palmitoyl-lyso-phosphatidylcholine (LPC) in PBS), LDL (low-density lipoprotein in PBS), LPS (lipopolysaccharide in PBS), PBS (phosphate-buffered saline vehicle), Ser (medium contained 10% fetal bovine serum)