
Fig. 3.
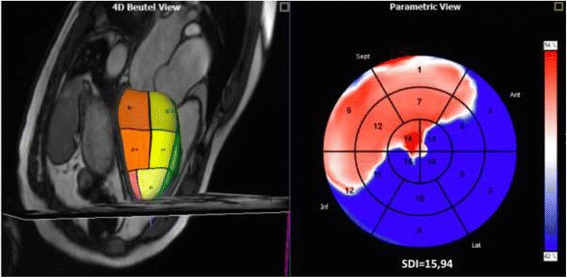
Left: 3D–model of the LV of a patient with EA with segmental subdivision in a three chamber view; Right: Map of myocardial activation representing a delay of the septal segments (blue = activated; red = not yet actived)
Official websites use .gov
A
.gov website belongs to an official
government organization in the United States.
Secure .gov websites use HTTPS
A lock (
) or https:// means you've safely
connected to the .gov website. Share sensitive
information only on official, secure websites.
Left: 3D–model of the LV of a patient with EA with segmental subdivision in a three chamber view; Right: Map of myocardial activation representing a delay of the septal segments (blue = activated; red = not yet actived)