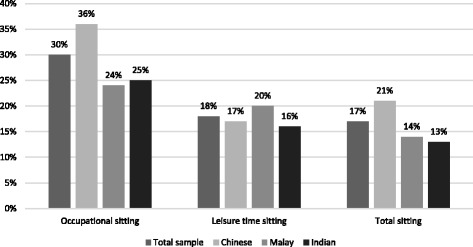
Fig. 1.

Proportion of the sample in the high sitting group, p < 0.01 for all comparisons.The cut-off for high total sitting time was ≥8 h/day. The cut-off for high occupational and leisure sitting time was ≥4 h/day

Proportion of the sample in the high sitting group, p < 0.01 for all comparisons.The cut-off for high total sitting time was ≥8 h/day. The cut-off for high occupational and leisure sitting time was ≥4 h/day