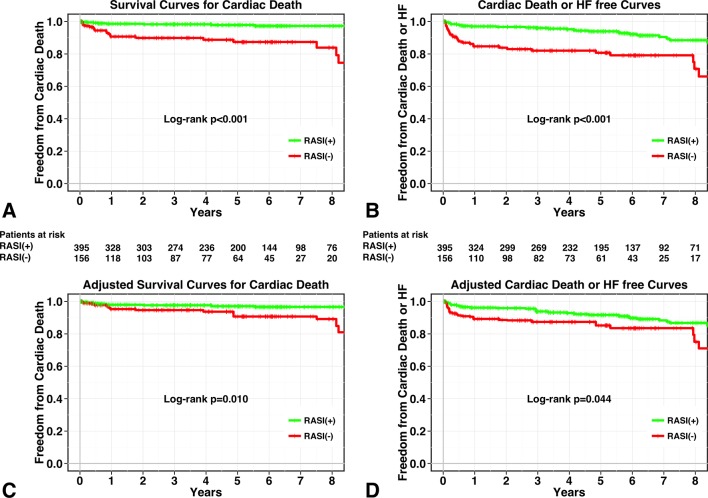
Figure 1.
Kaplan-Meier curves for patient groups with RASI therapy (green line) and without RASI therapy (red line). Unadjusted curves for cardiac death (A) and composite of cardiac death and HF (B) and inverse probability of treatment-weighted survival curves for cardiac death (C) and composite of cardiac death and HF (D). HF, heart failure; RASI, renin–angiotensin system inhibitor.

