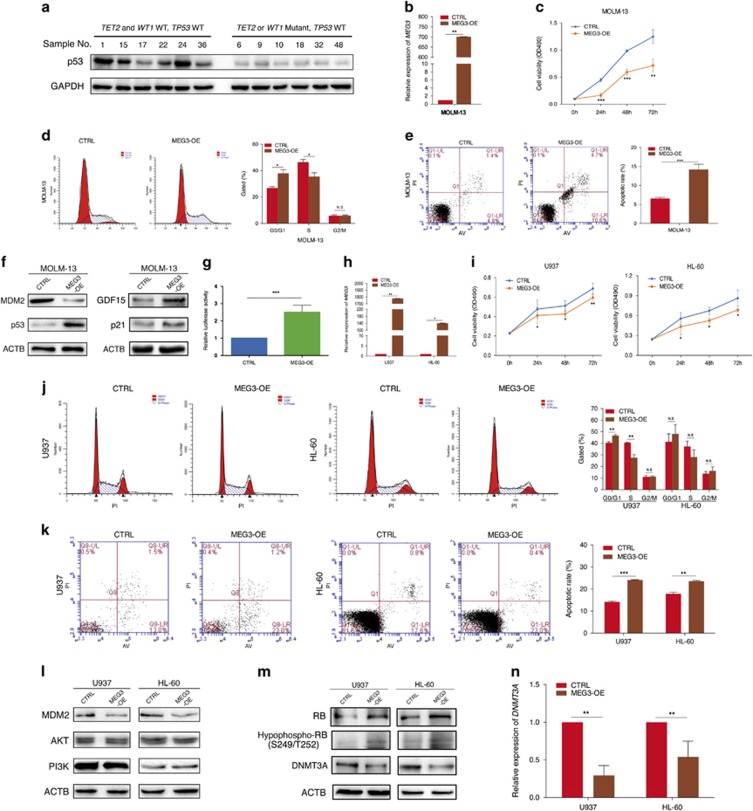
Figure 2.
Effect of MEG3 on cell proliferation and apoptosis in vitro. (a) Western blotting analysis of p53 protein levels in samples with/without TET2 or WT1 mutations. (b) RT-qPCR analysis of MEG3 RNA expression in MOLM-13 cell line. (c) MTT assay of the proliferation of MOLM-13 cell line. (d) The bar chart represented the percentage of cells in G0/G1, S or G2/M phase, as indicated. (e) The apoptotic rates of cells were detected by flow cytometry. (f) Western blotting analysis of MDM2, p53, GDF15 and p21 after pCDH-MEG3 and control transfection. (g) Induction of TP53 promoter activity by MEG3 in MOLM-13 cell line. (h) RT-qPCR analysis of MEG3 RNA expression in U937 and HL-60 cell lines. (i) MTT assay of the proliferation of U937 and HL-60 cell lines. (j) The bar chart represented the percentage of cells in G0/G1, S or G2/M phase, as indicated. (k) The apoptotic rates of cells were detected by flow cytometry. (l, m) Western blotting analysis of MDM2, AKT, PI3K, RB, hypophospho-RB (S249/T252) and DNMT3A after pCDH-MEG3 and control transfection in U937 and HL-60 cell lines. (n) RT-qPCR analysis of DNMT3A mRNA expression in U937 and HL-60 cell lines. Results shown were from three independent experiments. ACTB or GAPDH protein was used as an internal control for western blotting analysis. *P<0.05; **P<0.01; ***P<0.001. NS, not significant; RT-qPCR, real-time quantitative PCR.

