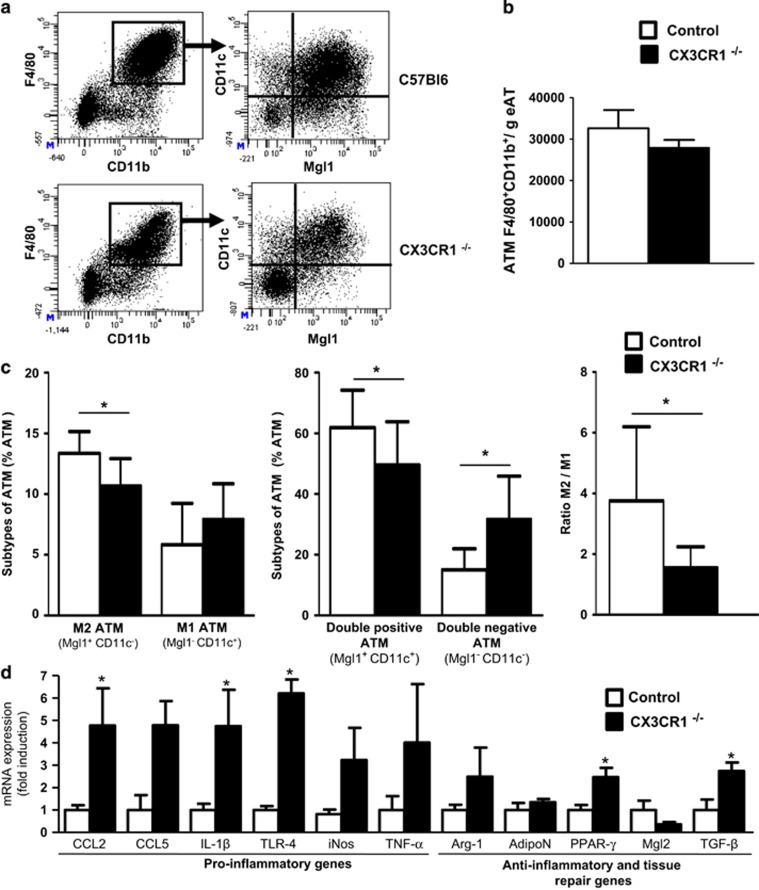
Figure 4.
Characterization of AT macrophage in CX3CR1−/− fed a HFD. (a) Dot plots of macrophages (F4/80+CD11b+CD45+ cells) in AT in CX3CR1−/− mice and control mice fed a diet of 60% kcal from fat for 30 weeks. (b) Histograms represent ATM content assessed by flow cytometry in CX3CR1−/− mice (n=9) and WT controls (n=8) treated as in a. (c) Characterization of M2 and M1 macrophages based on the expression of CD11c and Mgl1. Characterization of double-positive and double-negative macrophages for the two markers CD11c and Mgl1. Ratio of M2/M1 macrophages in mice described in b. (d) Levels of mRNA expression of functional M1 and M2 markers were evaluated by qPCR in adipose tissue from mice described in a (n=4 controls and 4 CX3CR1−/− mice, representative of two independent experiments). Relative mRNA expression of M1 and M2 genes was normalized to the average expression of two housekeeping genes (hypoxanthine guanine phosphoribosyl transferase and ribosomal protein S3). *P<0.05. Data are expressed as means±s.d.

