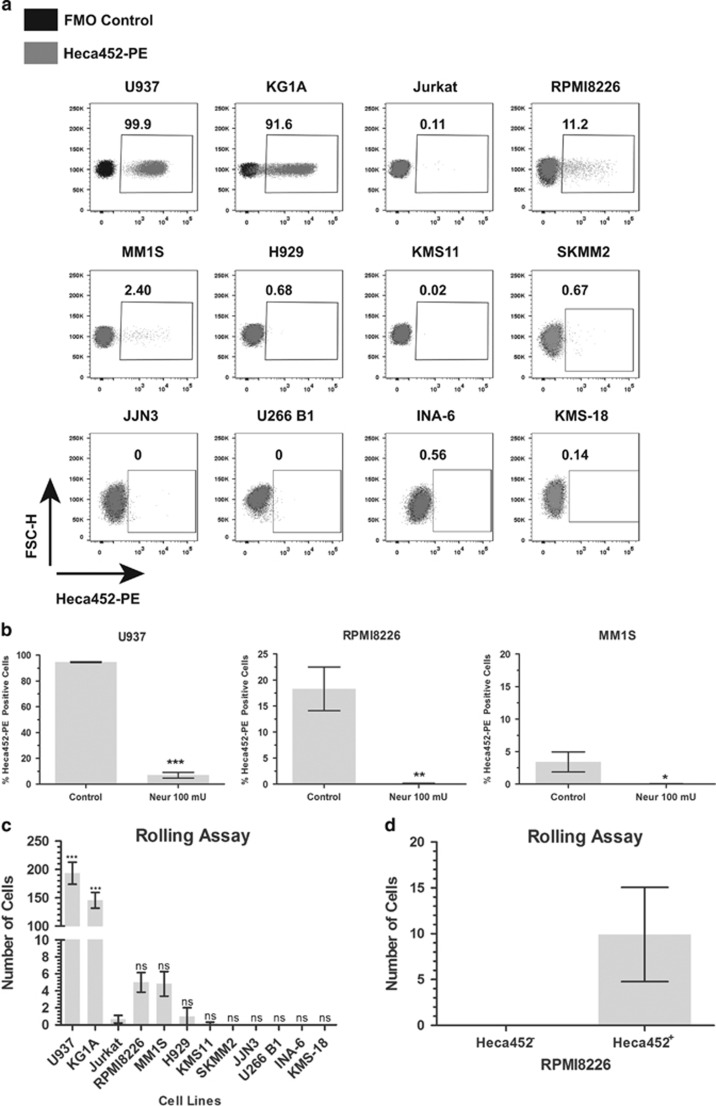
Figure 1.
Heca452-positive myeloma cells roll on recombinant E-selectin. (a) The MM cell lines RPMI8226, MM1S, H929, KMS11, U266 B1, SKMM2, KMS-18, INA-6 and JJN3 together with the myeloid cell lines U937 and KG1A, and the T leukemia cell line Jurkat were stained/mock stained with the Heca452-PE antibody and analyzed by flow cytometry using the BD FACS Canto II. Data are presented as a FSC-H/Heca452-PE dot plot overlay of the fluorescence minus one (FMO, black dots) control and the Heca452-PE-stained sample (gray dots). Gates were set according to the FMO controls. Numbers indicate the Heca452-positive cells within the gates. Results are representative of at least four independent experiments. Data were acquired and analyzed using the FACS DIVA (BD Biosciences, San Jose, CA, USA) and Flow Jo 10 (FlowJo LLC., Ashland, OR, USA), respectively. (b) U937, RPMI8226 and MM1S were treated/mock treated with Neuraminidase (100 mU) for 45 min and then analyzed by flow cytometry as described above. Bars represent mean±s.e.m. of three independent experiments. The one tailed unpaired t-test was used to determine statistical significance. *, ** and *** represent P-values <0.05, 0.01 and 0.001, respectively. (c) Eighty micro liter of the indicated cell lines were loaded onto E-selectin-coated microfluidic channels and rolling assay was performed at 0.5 dyne/cm2 at RT using the Mirus Evo NanoPump. Rolling cells were imaged using an A-Plan × 10/0.25 objective of an A10 Vert.A1 microscope equipped with a 01 QIClick F-M-12 Mono camera. Images were acquired using the Vena Flux Assay software (Cellix Ltd., Dublin, Ireland) and analyzed using the Image-Pro Premiere (Media Cybernetics, Rockville, MD, USA). Bars represent the mean±s.e.m. of three independent experiments performed in duplicate. The one way ANOVA test following the Dunnett post hoc test comparing all the bars to Jurkat was used to determine statistical significance. *** represents P-value <0.001. (d) RPMI8226 cells were sorted in Heca452-positive and -negative fractions using a BD FACSAria II sorter. Rolling assay was performed on sorted cells as described above. Bars represent mean±s.e.m. of four independent experiments performed in triplicate. Statistical analysis was performed using Prism GraphPad Version 5 (GraphPad Software Inc., La Jolla, CA, USA). ANOVA, analysis of variance; FACS, fluorescence-activated cell sorter; NS, non significant.

