Fig. 7.

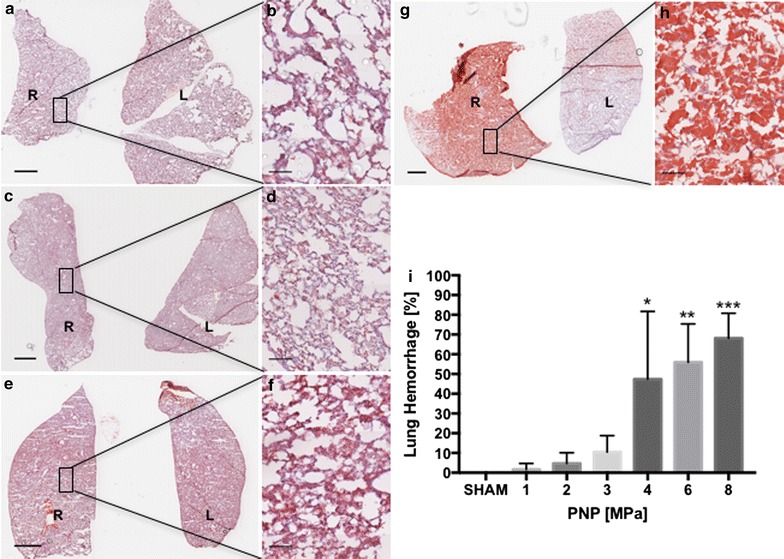
H&E staining of pFUS-treated myocardium. a, b Sham control revealed that little hemorrhage was observed. c, d pFUS exposure at 1 MPa showed no difference compared to sham. e, f pFUS exposure at 3 MPa produced little pulmonary hemorrhage. g, h pFUS exposure at 6 MPa caused extensive pulmonary hemorrhage. i Quantitation of pulmonary hemorrhage. b, d, f, and h are high magnification views of a, c, e and g respectively. L and R represent left and right lungs a, c, e, g scale bar = 2 mm. b, d, f, h Scale bar = 100 µm. Statistical significance was set at p < 0.05 based on ANOVA
