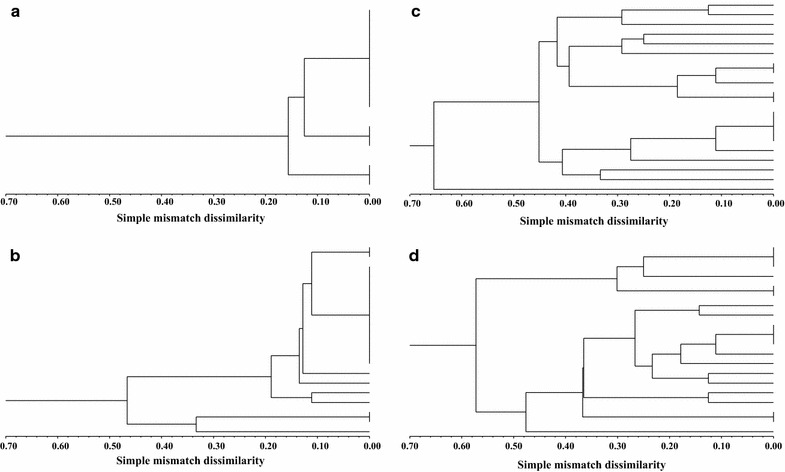
Fig. 1.

Dendrograms of the populations, showing their clonal diversity (KW Kosman index, NG number of genotypes, SW Shannon–Wiener index): a Majrase, KW = 0.100, NG = 3, SW = 0.41. b Timna, KW = 0.222, NG = 8, SW = 0.67. c Zafzefa, KW = 0.542, NG = 15, SW = 1.12. d Sapir, KW = 0.564, NG = 14, SW = 1.10. Ein Kaftor (KW = 0, NG = 2, SW = 0.30) and Nofarim (KW = 0.008, NG = 2, SW = 0.06) did not allow production of relevant dendrograms, as the simple mismatch dissimilarity among individuals was extremely low, as expected from populations with low clonal diversity
