Fig. 2.

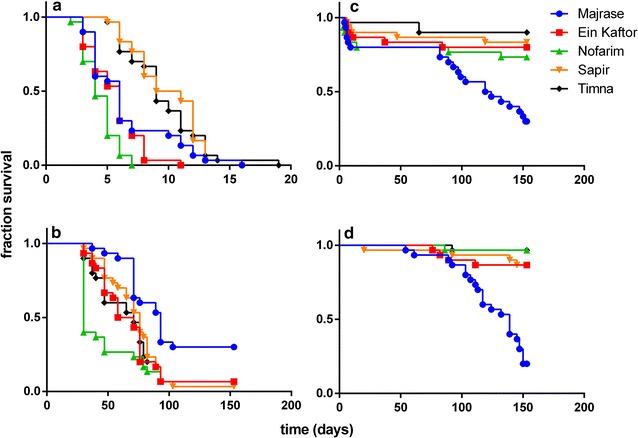
Kaplan-Meier survival curves for five M. tuberculata populations under four conditions: a high temperature, b low temperature, c high salinity level, d control

Kaplan-Meier survival curves for five M. tuberculata populations under four conditions: a high temperature, b low temperature, c high salinity level, d control