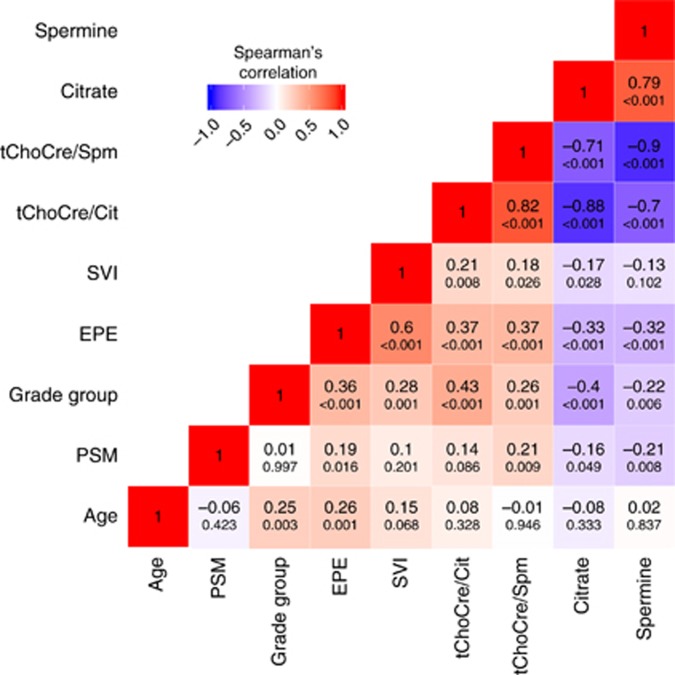
Figure 3.
Correlation heatmap. Correlations between metabolites and clinicopathological factors. The Spearman’s correlation coefficients are shown inside the boxes (large font), with corresponding P-values below. The colour scale indicates the sign of the correlation coefficients and the degree of correlation, where blue indicates negative correlation, white no correlation, and red positive correlation. EPE, extraprostatic extension; PSM, positive surgical margins; SVI, seminal vesicle invasion; tChoCre/Cit, (total-choline+creatine)/citrate; tChoCre/Spm, (total-choline+creatine)/spermine.

