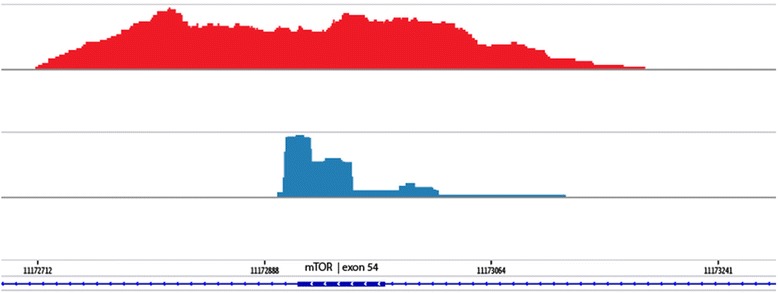
Fig. 1.

Sashimi target enrichment plots. mTOR Exon 54 coverage for two different target enrichment methods is represented by a Sashimi plot: 1) hybridization capture-based technique, showing more bell-shaped enrichment of random fragments (red histogram) and 2) amplicon- or multiplex PCR-based approach, showing vertical enrichment blocks of identical fragments (blue histogram)
