Figure 3.
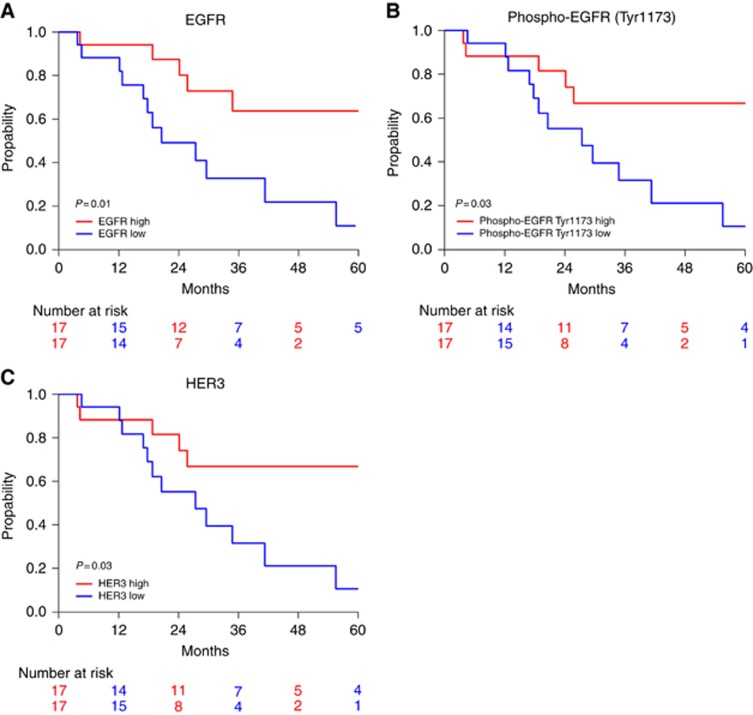
(Phospho-)proteins associated with overall survival. Kaplan–Meier curves of overall survival according to expression levels of EGFR (A), phospho-EGFR (Tyr1173) (B) and HER3 (C). Red line: expression higher than the median expression level; blue line: expression lower than the median. The result of the log-rank test is indicated in each graph and the patients at risk over time are indicated below each graph.

