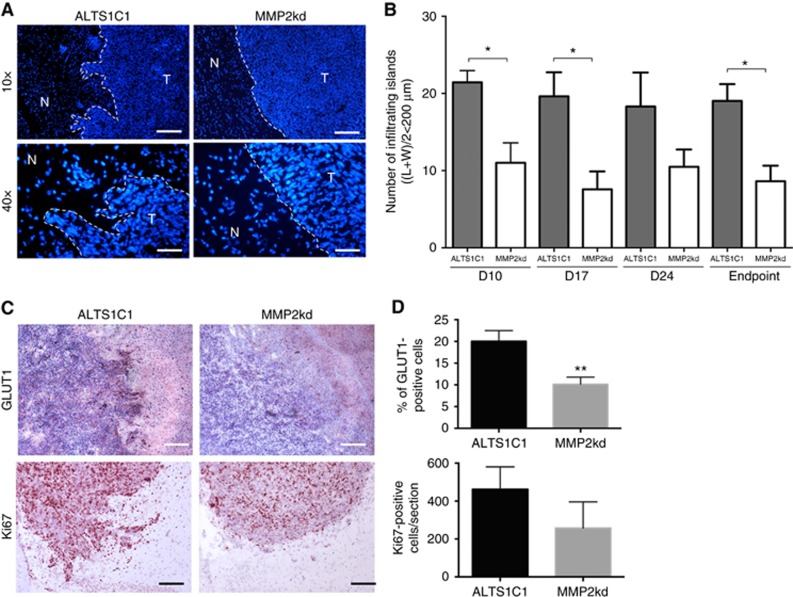
Figure 4.
MMP2 expression promoted tumour invasion. (A) Representative images of tumour borders stained with DAPI in ALTS1C1 and MMP2kd tumours from day 17 tissues. ALTS1C1 had an invasive front and small tumour-infiltrating islands, but MMP2kd tumours had smooth boundaries and few islands. T indicated the local tumour site and N indicated the normal brain tissue. (B) Number of infiltrating islands in the brain was counted at the indicated day. The plot represents the average island numbers of three brains on each group observed under × 100 magnification and repeated in three independent experiments. (C) Representative images of GLUT-1 (upper panel) and Ki67 (lower panel) expression in the tumour margin of ALTS1C1 and MMP2kd tumours from day 17 tissues. The nucleus was visualised with haematoxylin staining (blue). (D) The quantification data for the comparison of GLUT-1 and Ki67 in the tumour margin of ALTS1C1 and MMP2kd tumours. *P<0.05, **P<0.01.

