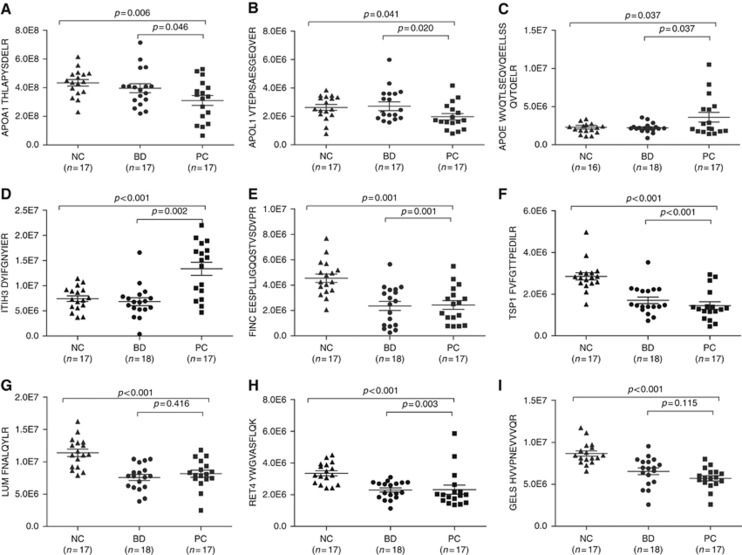
Figure 2.
Plots of determined concentrations of 9 differentially expressed proteins using P-MRM. The concentration of AOPA1 (A), APOL1 (B), APOE (C), ITIH3 (D), FINC (E), TSP1 (F), LUMA (G), RET4 (H) and GELs (I) in different groups are illustrated. The mean value and standard deviations of the serum proteins from the NC, BD, and PC groups are shown. Student’s t-test was used for the pairwise comparisons of the concentrations of proteins from the NC, BD, and PC groups. A P-value <0.05 was considered statistically significant. BD = benign diseases; NC = normal control; PC = pancreatic carcinoma.

