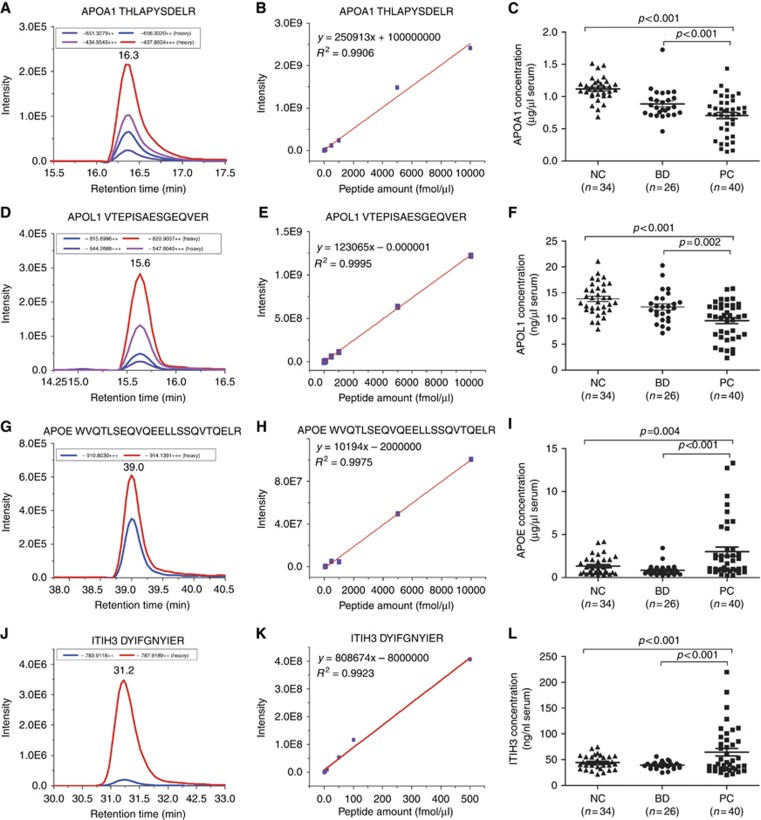
Figure 3.
Absolute quantification of APOE, ITIH3, APOA1, and APOL1 in the NC, BD and PC groups using the SID-MRM method. Extracted ion chromatograms (A, D, G, J), Standard curves (B, E, H, K) and Group comparison of the concentrations (C, F, I, L) of the 4 peptides in the NC, BD and PC groups are illustrated. The mean value and standard deviations of the serum proteins from the NC, BD, and PC groups are shown. Student’s t-test was used for the pairwise comparisons of the concentrations of proteins from the NC, BD, and PC groups. A P-value <0.05 was considered statistically significant. BD = benign diseases; NC = normal control; PC = pancreatic carcinoma.

