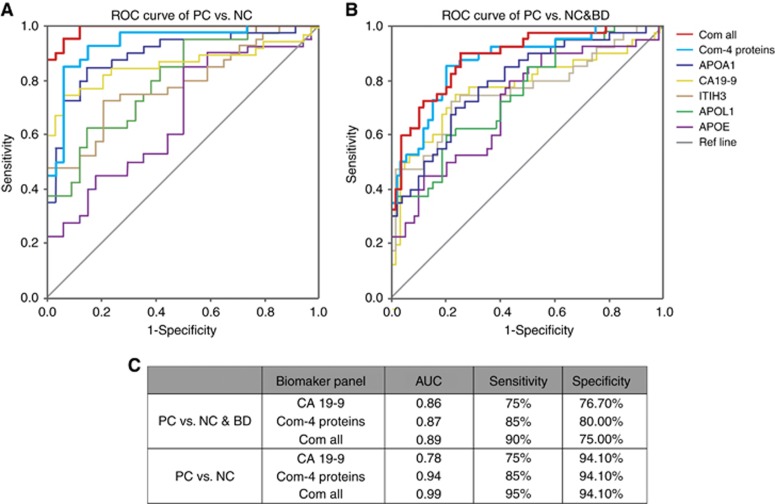
Figure 4.
ROC analysis of the newly developed biomarker panels. ROC Curves of APOA1, APOL1, ITIH3, APOE, CA19-9, the combinations of the 4 novel protein biomarkers (Com-4 proteins) and the combination all five elements (Com-all) are shown for differentiating PC vs NC group (A), and PC vs NC & BD groups (B). The AUC, sensitivity and specify of CA19-9 alone, Com-4 proteins and Com-all are demonstrated (C). BD = benign diseases; NC = normal control; PC = pancreatic carcinoma.

