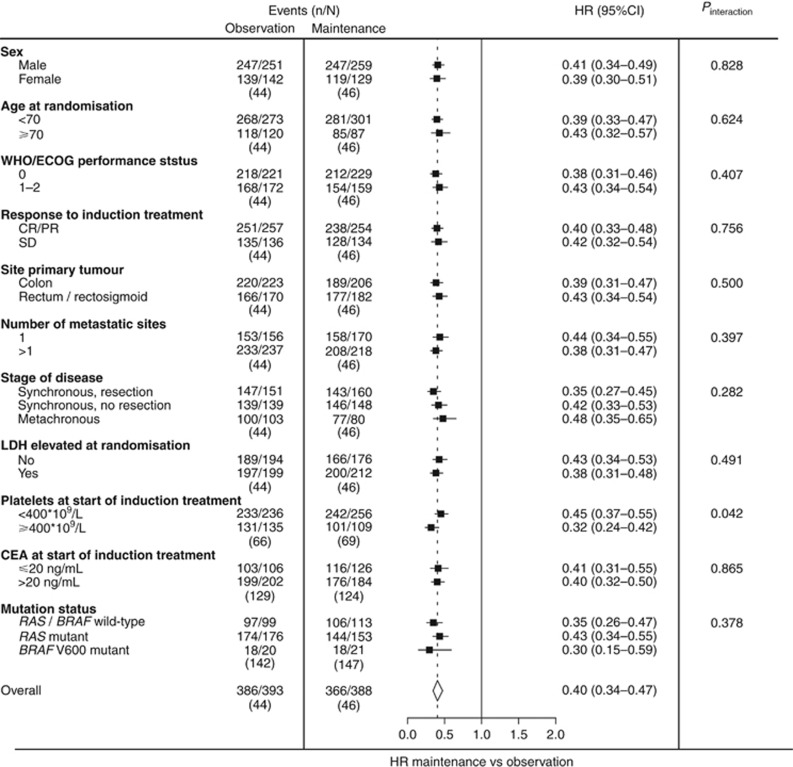
Figure 2.
Forest plot showing adjusted treatment effects for PFS1 in subgroups with P-values for heterogeneity across subgroups. Analyses were performed using a mixed effect Cox model with study as random intercept and treatment (and any co-variables) as fixed effects. Subgroup analyses were stratified for prior adjuvant chemotherapy, response to induction treatment, WHO/ECOG PS, and adjusted for age, sex, stage, primary tumour location, primary tumour resection, number of metastatic sites, LDH at randomisation, and interval between primary diagnosis and randomisation. Subgroup analyses for ‘stage of disease and primary tumour resection status’ were not adjusted for stage and primary tumour resection. CR/PR=complete or partial response; SD=stable disease.

