Figure 4.
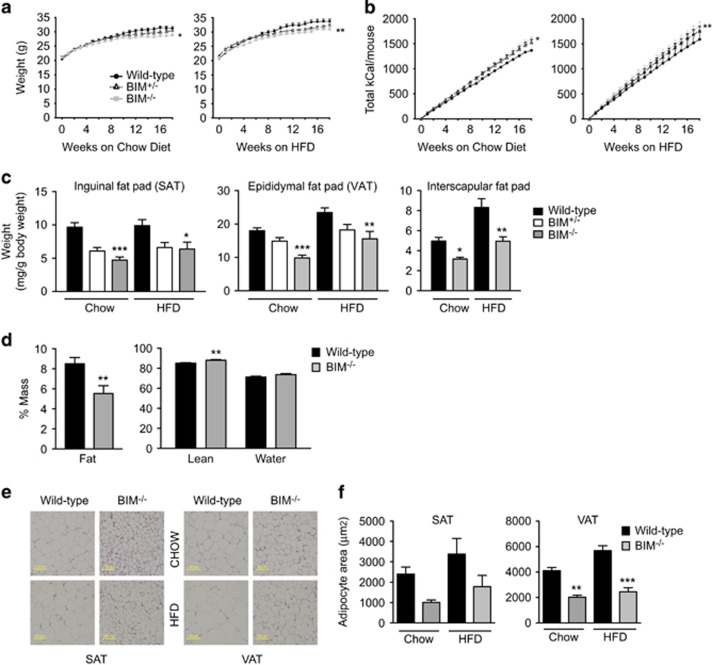
BIM-deficient mice have reduced body weight and adiposity. (a,b) Body weights in g (a) and cumulative calorie intake (b) of wild-type, BIM+/− and BIM−/− male mice on chow (left) or high-fat diet (right) measured weekly from 6 weeks of age for 18 weeks. n=14–16 mice/genotype. *P<0.05, **P<0.01 BIM−/− versus wild-type mice on similar diet (two-way ANOVA). (c) Weight of inguinal fat pad (SAT), epididymal fat pad (VAT), and interscapular brown fat pad measured after 18 weeks (24 weeks of age) and normalised to total body weight (mg/g body weight). n=9–16 mice/genotype *P<0.05, **P<0.01, ***P<0.001 BIM−/− versus wild-type mice on similar diet (one-way ANOVA). (d) Body composition determined at 18 weeks of age in chow-fed mice by MRI scanning. % fat, lean, and water mass are shown. n=7–8 mice/genotype. **P<0.001 BIM−/− versus wild-type mice (Student’s t-test). (e) Formalin-fixed sections of inguinal fat pads (SAT; left) and epididymal fat pads (VAT; right) isolated from 24-week-old chow-fed or HFD-fed male wild-type mice or BIM−/− mice stained with H&E. Representative images of n=4 mice/genotype. Scale bar 100 μm. (f) Quantification of adipocyte cross-sectional area of SAT and VAT from chow-fed and HFD-fed mice, n=4 mice/genotype. **P<0.01, ***P<0.001 BIM−/− versus wild-type mice on similar diet (one-way ANOVA). Data show mean±S.E.M.

