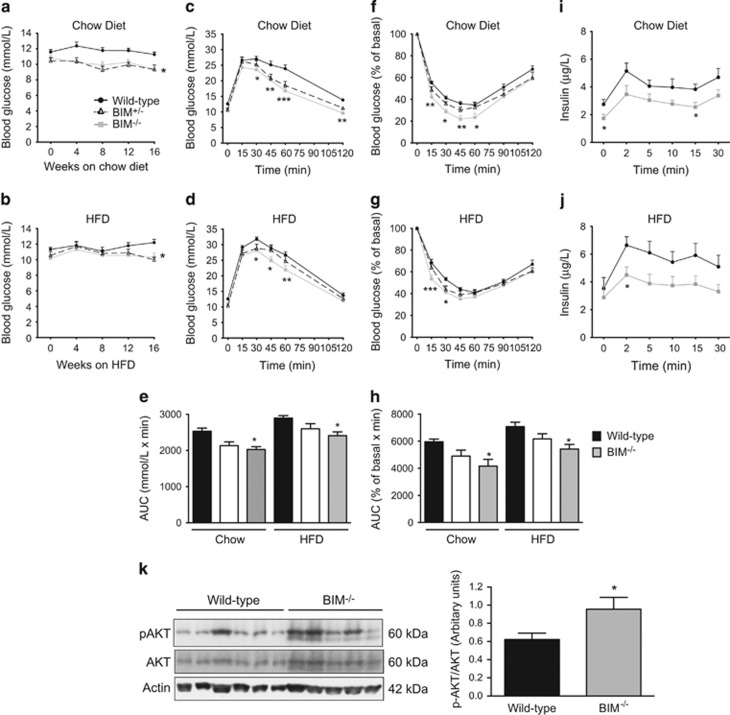
Figure 5.
Improved glucose homoeostasis in BIM-deficient mice. (a,b) Blood glucose concentration (mmol/l) measured every four weeks after 7–8 h of fasting for mice on chow (a) and high-fat diet (b). n=14–16 mice/genotype. *P<0.05 BIM−/− versus wild-type mice on similar diet (two-way ANOVA). (c, d) IP-GTT performed on 20-week-old mice after 6 h of fasting by injecting 2 g/kg of glucose. Results for the chow-fed mice (c) and high-fat-fed mice (d) are shown. n=14–16 mice/genotype. (e) Area under the curve (AUC) for the IP-GTT data from chow and high-fat-fed mice. n=14–16 mice/genotype. For (c–e) *P<0.05, **P<0.01 and ***P<0.001 BIM−/− versus wild-type mice on similar diet (two-way ANOVA). (f, g) IP-ITT was performed on 18-week-old mice after 4 h of fasting by injecting 0.75 U/kg of insulin. Results are expressed as a percentage of basal blood glucose concentration and are shown for the chow-fed mice (f) and high-fat-fed mice (g). n=14–16 mice/genotype. (h) Area under the curve (AUC) for the IP-ITT data from chow and high-fat-fed mice. n=14–16 mice/genotype. For (f–h) *P<0.05, **P<0.01 and ***P<0.001 BIM−/− versus wild-type mice on similar diet (two-way ANOVA). (i,j) Plasma insulin concentrations for samples obtained during IV-GTT determined by ELISA. Results for the chow-fed mice (i) and high-fat-fed mice (j) are shown. n=9–11 mice/genotype. *P<0.05 (Student’s t-test). (k) Western blot of phosphorylated AKT (pAKT), total AKT, and actin (loading control) performed on liver lysates isolated from 20-week-old male mice after 6 h of fasting. Liver samples were isolated 10 min after intraperitoneal injection of insulin. n=5–6 mice/genotype. Quantification of western blots for pAKT normalised to total AKT. *P<0.05 BIM−/− versus wild-type mice on chow diet (Student’s t-test). Data show mean±S.E.M.

