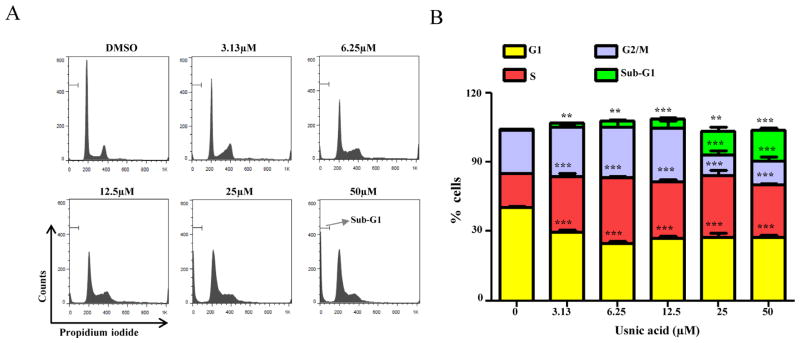
FIG. 2.
Effect of usnic acid on cell cycle. (A) Flow cytometric analysis of cell cycle distribution. Histograms shown are DNA content analyses for HepG2 cells treated with the indicated concentrations of usnic acid for 24 h. Cells were stained with propidium iodide and processed for cell cycle analysis. (B) The bar graph depicts the percentage of each cell cycle phase ± SD from four independent experiments. **p < 0.005, and ***p < 0.001 versus the respective sub-G1, G1, S, or G2/M phase of DMSO-treated cells.

