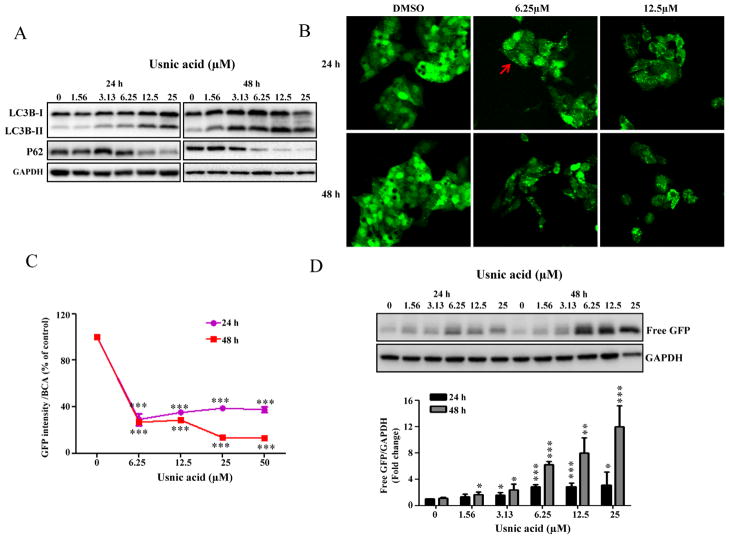
FIG. 4.
Usnic acid induces autophagy in HepG2 cells. (A) HepG2 cells were treated with usnic acid at the indicated concentrations for the indicated times and Western blotting analysis was performed using antibodies against LC3B and P62 in whole cell lysates. (B) HepG2-GFP-LC3B cells were incubated with the indicated concentration of usnic acid for 24 and 48 h. The GFP-LC3B punctuation/aggregation (arrow) was observed by confocal laser microscope. Representative images were from three independent experiments. (C) HepG2-GFP-LC3B cells were seeded in 96-well plates and treated with usnic acid at indicated concentrations for 24 and 48 h. The fluorescence intensity was measured as described under the Materials and Methods section; the results shown are mean ± SD of four separate experiments. ***p < 0.001 compared with the control for each time point. (D) Western blotting analysis was performed with an antibody against GFP using lysates from HepG2-GFP-LC3B cells exposed to usnic acid at indicated concentrations for 24 and 48 h (top panel). The bars represent the densitometric analysis of free GFP expression (bottom panel). Intensities of bands of free GFP were normalized to the amount of GAPDH. Data are mean ± SD of three individual experiments. *p < 0.05, **p < 0.01, and ***p < 0.001 compared with the control for each time point.

