Fig. 3.

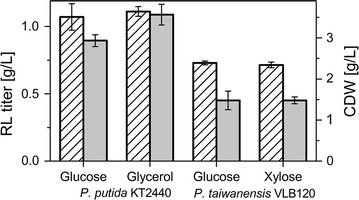
Mono-rhamnolipid production using alternative carbon sources. CDW and rhamnolipid titers are presented in g/L (striped columns and grey columns, respectively). The error bars represent the deviation from the mean of two biological replicates

Mono-rhamnolipid production using alternative carbon sources. CDW and rhamnolipid titers are presented in g/L (striped columns and grey columns, respectively). The error bars represent the deviation from the mean of two biological replicates