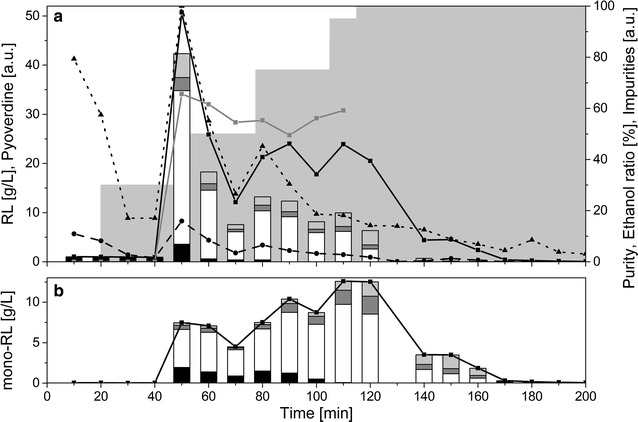
Fig. 6.

Purification of di-rhamnolipids using an adsorption/desorption procedure. a The composition of the different fractions collected is shown. Each fraction corresponds to 10 min of elution. The black curve with the squares displays the total rhamnolipid (mono and di) concentration in g/L. The black dashed line with the circles shows the pyoverdine content in arbitrary units, while the black dotted line with triangles represents other impurities measured by absorption at 400 nm in arbitrary units. The gray line with squares displays the purity. The grey area in the background shows the composition of the elution solution with stepwise increasing ethanol concentrations. The stacked bars display the congener’s composition of the di-rhamnolipids. Black bars: Rha-Rha-C8-C10, white bars: Rha-Rha-C10-C10, dark grey bars: Rha-Rha-C10-C12:1, light grey bars: Rha-Rha-C10-C12 (all in g/L). b Mono-rhamnolipids contained in the fractions. The black line depicts the total mono-rhamnolipid concentration, while the stacked bars represent the amount of mono-rhamnolipid congeners. Black bars: Rha-C8-C10, white bars: Rha-C10-C10, dark grey bars: Rha-C10-C12:1, light grey bars: Rha-C10-C12 (all in g/L)
