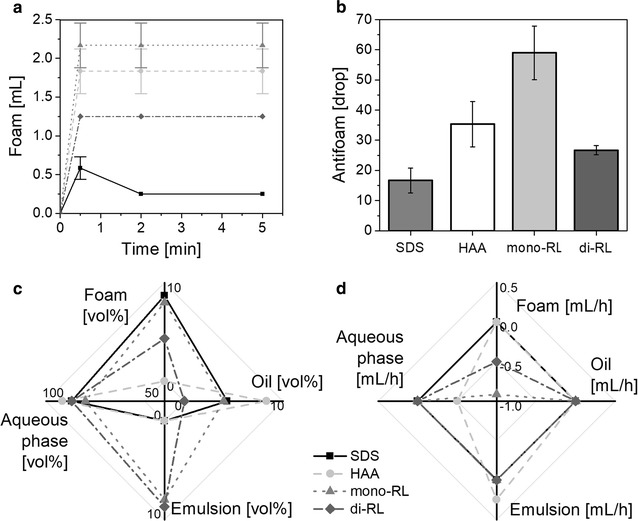
Fig. 7.

Biosurfactant properties. a Foaming capabilities I. Course of the foam formation over time. HAAs are represented by the light grey dashed line with circles, mono-rhamnolipids by the dotted grey line with triangles, di-rhamnolipids by the dark grey line with diamonds, SDS is depicted by black line with squares and serves as a reference. b Foaming capabilities II. Amount of added antifoam during the testing of the antifoam effectiveness. The error bars represent the deviation of the mean of three experiments. c Emulsification capability. Volumetric percentage of the different phases foam, oil, emulsion, and aqueous phase of the initial emulsion. d Emulsion stabilization. Volumetric change over time of the different phases foam, oil, emulsion, and aqueous phase
