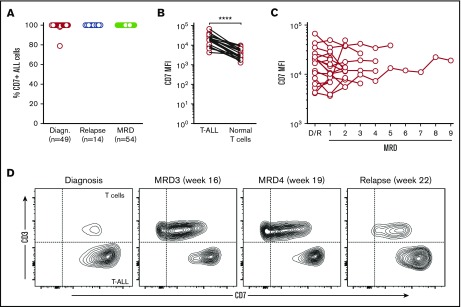
Figure 1.
CD7 expression in T-ALL. (A) The percentage of ALL cells expressing CD7 at diagnosis, relapse, and during chemotherapy (MRD); the number of bone marrow samples studied at each stage is shown. (B) CD7 mean fluorescence intensity (MFI) in T-ALL cells and residual normal T cells from the same samples (n = 19; ****P < .0001 by paired Student t test). (C) CD7 MFI in T-ALL cells at diagnosis or relapse (D/R) and in follow-up bone marrow samples with MRD (n = 18). (D) Flow cytometric contour plots illustrate CD7 expression in T-ALL cells (CD3 negative) and normal T cells (CD3 positive) at diagnosis, MRD, and relapse in 1 representative patient.

