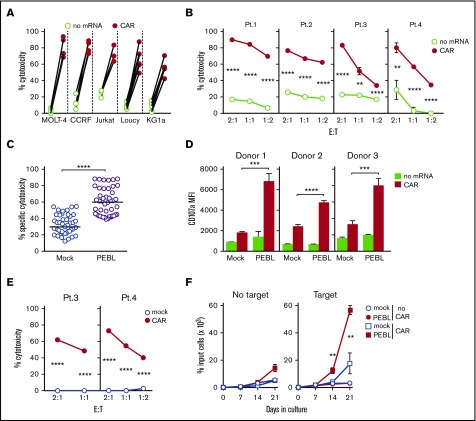
Figure 5.
T cells with downregulated CD7 by PEBL acquire powerful cytotoxicity against CD7+leukemic cells after expression of anti-CD7 CAR. (A) Cytotoxicity of anti-CD7 PEBL-transduced T cells electroporated with or without anti-CD7 CAR mRNA against CD7+ cell lines. Shown are data for 4-hour assays at a 1:1 E:T ratio. Symbols indicate the mean of 3 measurements each with T cells from 4 donors for MOLT-4, CCRF-CEM, and Jurkat, and 5 donors for Loucy and KG1a (P < .001 for each comparison). (B) Cytotoxicity of anti-CD7 PEBL-transduced T cells electroporated with or without anti-CD7 CAR mRNA against primary leukemic cells from patients with T-ALL. Shown are data for 4-hour assays at the indicated E:T ratio. Symbols refer to the mean (± SD) of 3 measurements. (C) Overall specific cytotoxicity of T cells transduced with either anti-CD7 PEBL or GFP alone (Mock) after electroporation with anti-CD7 CAR mRNA against the 5 CD7+ cell lines. T cells from 3 donors were tested at a 1:1 E:T ratio in 4-hour assays. Each symbol represents the specific percentage of cytotoxicity against the CD7+ cell line after subtraction of the percentage of cytotoxicity obtained with the same T cells electroporated without mRNA. Horizontal bars indicate the median for each group. (D) Anti-CD7 PEBL- or mock-transduced T cells from 3 donors were electroporated with or without anti-CD7 CAR mRNA. Cytotoxicity against MOLT-4 was tested at a 1:1 E:T ratio in 4-hour assays. Shown is the MFI of anti-CD107a–PE (H4A3; BD Biosciences). Bars represent the mean (± SD) of triplicate experiments. (E) Anti-CD7 PEBL-transduced T cells were retrovirally transduced with either anti-CD7 CAR or mock-transduced and tested against primary leukemic cells from patients with T-ALL. Each symbol represents the mean (± SD) of triplicate experiments. (F) Mock- or PEBL-transduced T cells, sequentially transduced with or without anti-CD7 CAR, were cultured alone or in the presence of Streck-treated MOLT-4 cells, added weekly and 120 IU/mL IL-2. Symbols indicate the mean (± SD) percentage of cell recovery relative to the number of input cells in triplicate cultures. **P < .01; ***P < .001; ****P < .0001.

