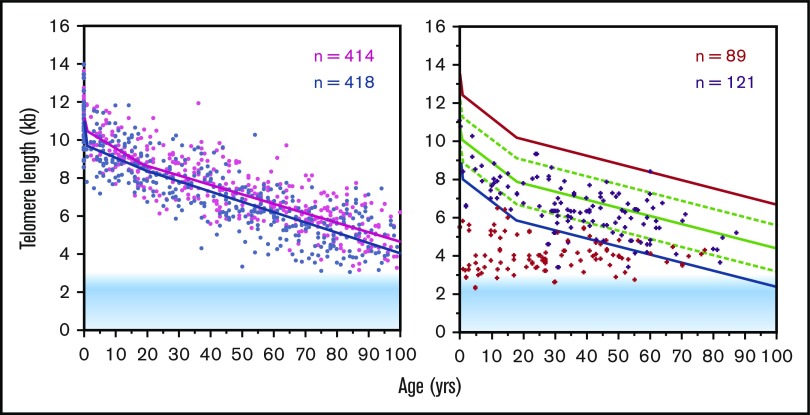
Figure 3.
Telomere length declines with age in human lymphocytes measured using flow FISH. The left panel shows that the average difference in telomere length between females (pink) and males (blue) persist throughout life. The right panel shows the telomere length in individuals with “telomeropathies,” in this case, heterozygous carriers of a mutation in either the TERC or the TERT gene (red) and their unaffected siblings (purple). Figure adapted from data shown in Aubert et al.18

