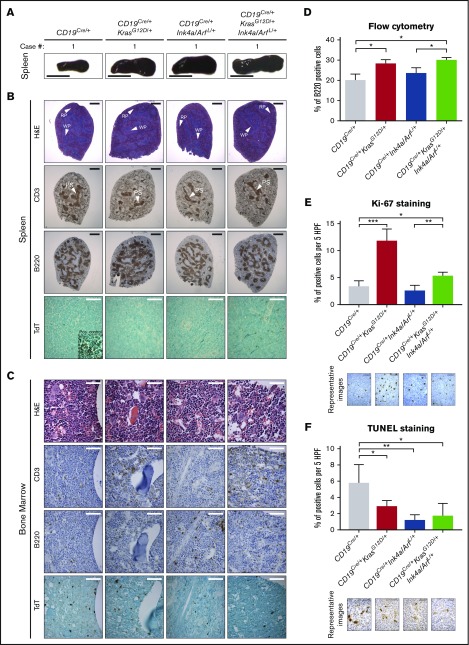
Figure 1.
Analysis of 8-week-old mice with conditional expression of KrasG12Dand loss of Ink4a/Arf. (A) Representative gross pictures of dissected spleens from mice of the indicated genotypes. Scale bar, 1 cm. (B-C) Representative histologic and IHC analyses of CD3, B220, and TdT expression in (B) spleens and (C) BM from mice of the indicated genotypes. Inset, positive control: TdT staining of thymus from the same mouse. Scale bars: black, 1 mm; white, 50 µm (see supplemental Figure 2). (D) Mean percentage of B220+ cells assessed by flow cytometry in splenocytes from mice of the indicated genotype; error bars represent ± standard deviation (SD) of 3 different mice per genotype. P values were calculated by using Welch’s t test. (E-F) Differences in the number of proliferating and apoptotic cells assessed by Ki-67 (E) IHC analysis of B-cell areas and (F) TUNEL assay of germinal center areas, respectively, in spleens from mice of the indicated genotypes, calculated using ImageJ. Bar plots represent mean number of cells per 5 high-power fields (HPFs); error bars ± SD. P values were calculated by using Welch’s t test. Representative images are shown below the graphs. Scale bar, 25 µm. Two independent assays were performed for all experiments for which statistics were calculated. *P ≤ .05, **P ≤ .01, ***P ≤ .001. H&E, hematoxylin and eosin; PS, periarterial sheath; RP, red pulp; WP, white pulp.

