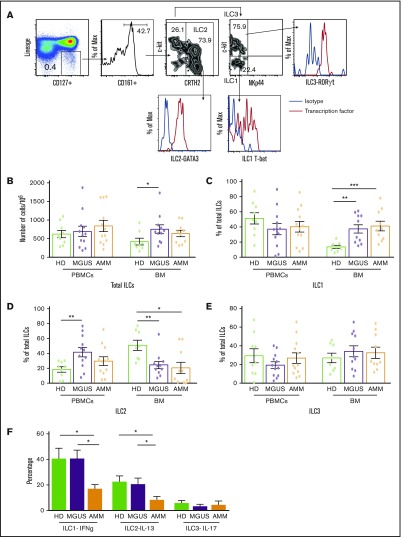
Figure 1.
Changes in ILC and ILC subsets in gammopathies. (A) Representative fluorescence-activated cell sorter FACS plots showing the gating strategy to identify ILC1, ILC2, and ILC3 along with their transcription factors T-bet, GATA3, and RORγt, respectively. MNCs were stained with dye to exclude dead cells and a cocktail of antibodies (lineage: CD1a, CD34, CD94, CD123, TCRαβ, TCRγδ, FCεR1, CD303, CD11c, CD14, CD19, CD3, and CD138 in bone marrow from patients with plasma cell disorders) to exclude cells with known lineages. ILCs were then identified in a lineage-negative subset based on the expression of CD127 and CD161, and then classified as ILC1, ILC2, or ILC3 on the basis of the expression of CRTH2, c-kit, and NKp44. ILCs were identified as lineage CD127+CD161+ cells and subclassified as ILC2 (CRTH2+c-kit+/−), ILC1 (NKp44–c-kit–), or ILC3 (Nkp44–c-kit+). (B-E) Total ILCs and ILC subsets in peripheral blood mononuclear cells (PBMCs) or bone marrow (BM) samples from healthy donors (HDs; n = 9) and MGUS (n = 12) or AMM patients (n = 12) were evaluated by using flow cytometry. All graphs show mean ± standard error of the mean (SEM). (B) Total ILCs in peripheral blood and BM of HDs as well as MGUS and AMM patients. Proportion of (C) ILC1, (D) ILC2, and (E) ILC3 in PBMCs and BM samples of HDs and MGUS and AMM patients. (F) Cytokine production by ILC subsets upon stimulation with phorbol myristate acetate (PMA) and ionomycin. Bar graph (mean + SEM) shows the IFN-γ–producing ILC1s, IL-13–producing ILC2s, and IL-17–producing ILC3s in HD BM (n = 4), MGUS BM (n = 6), and AMM BM (n = 6). *P < .05; **P < .01; ***P < .001.

