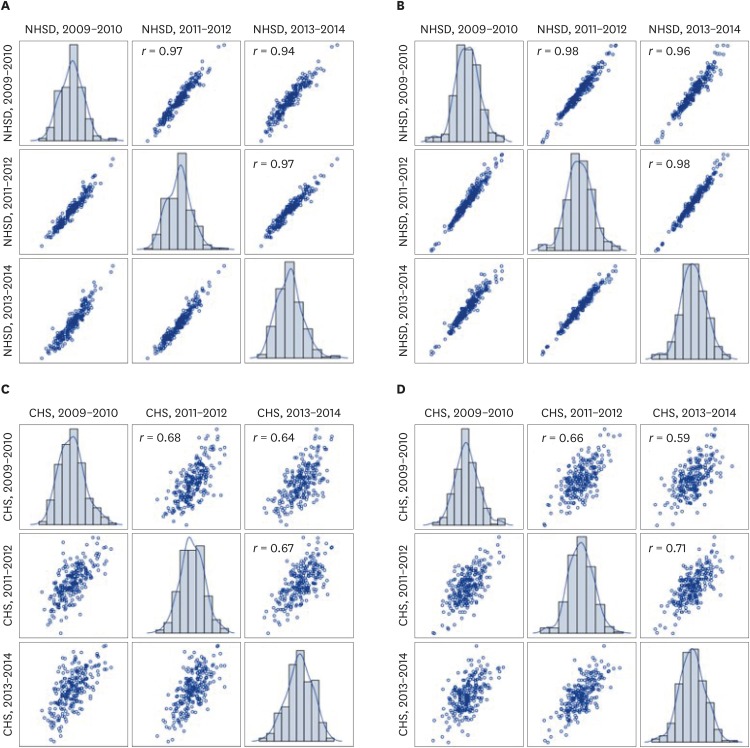
Fig. 2.
Scatter plots (and correlation coefficients [r]) for correlations of age-standardized overweight prevalence between biennial time periods of analysis, findings from the NHSD and the CHS in Korea, 2009–2014. (A) Results from the NHSD in men. (B) Results from the NHSD in women. (C) Results from the CHS in men. (D) Results from the CHS in women.
NHSD = National Health Screening Database, CHS = Community Health Survey.

