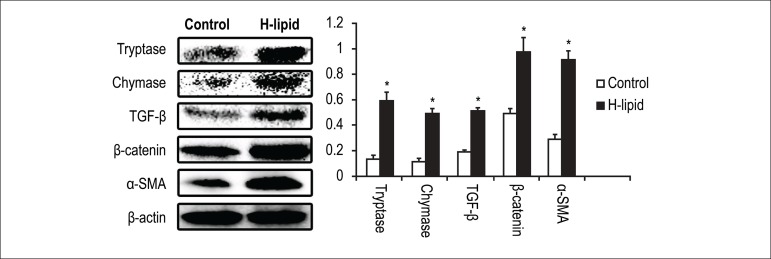
Figure 2.
Effect of hyperlipidemia on the protein expression of tryptase, chymase, TGF-β, β-catenin and α-SMA in hyperlipidemic mice's hearts. The bar graph shows the relative expression ratio of each protein calculated after normalization by β-actin. Data are expressed as mean± S.D. (*p < 0.05 vs Control group; n = 8)

