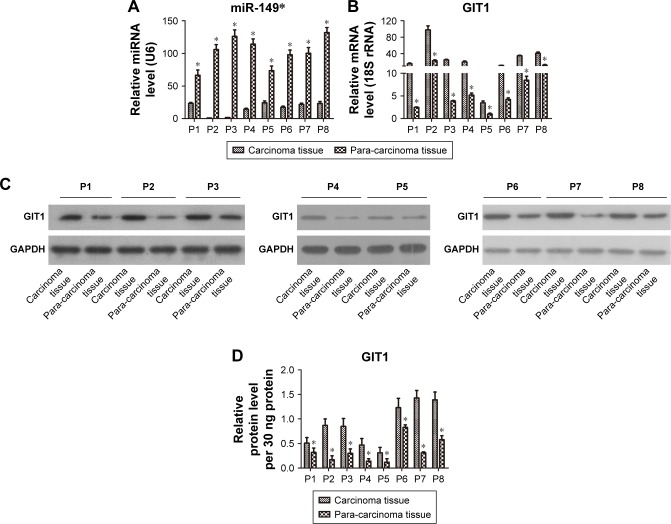
Figure 1.
Comparisons of miR-149* and GIT1 expressions in breast tumor tissues and adjacent nontumor tissue.
Notes: (A) Relative quantification of miR-149* was determined by qRT-PCR. (B) Relative quantification of GIT1 was examined by qRT-PCR. (C) GIT1 protein expression was measured by WB. (D) The statistical histogram of GIT1 protein. *P<0.05. “P” denotes patients.
Abbreviations: qRT-PCR, quantitative reverse transcription-polymerase chain reaction; WB, Western blot.

