Figure 3.
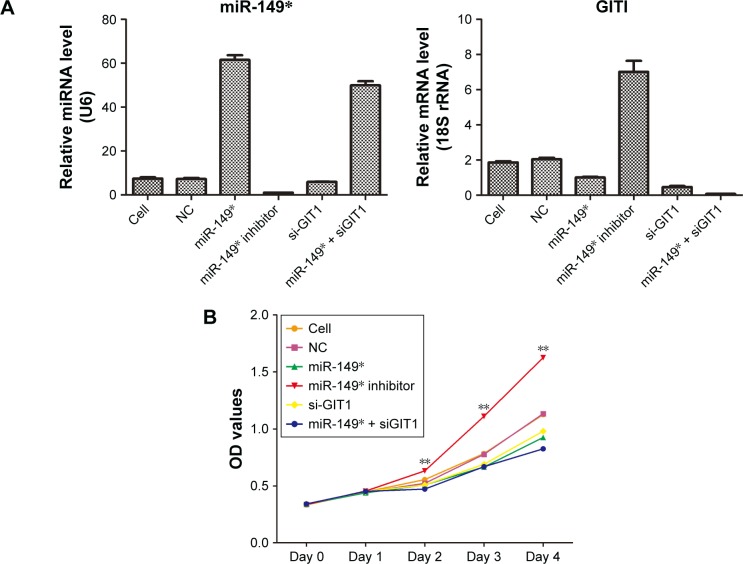
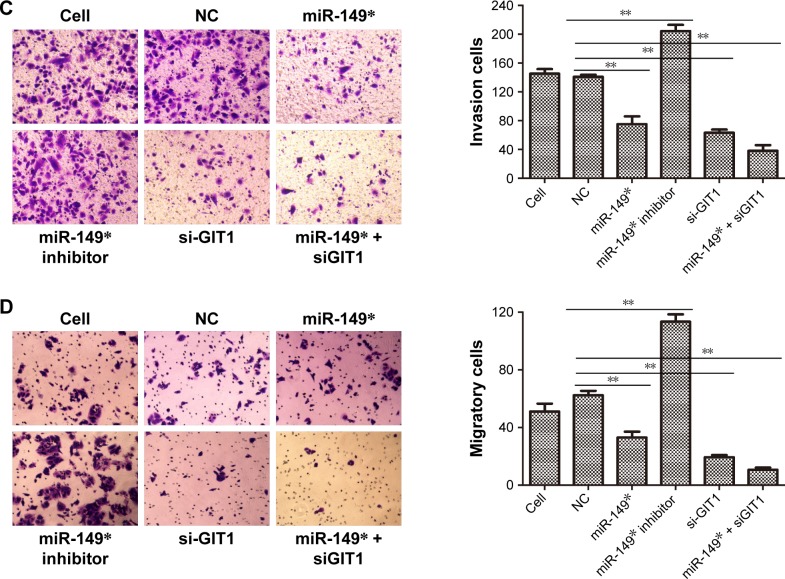
The effects of miR-149* and GIT1 on cell proliferation, invasion, and migration.
Notes: (A) The miR-149* and GIT1 expressions were measured by qRT-PCR to demonstrate the transfection efficiency of NC, miR-149*, miR-149* inhibitor, si-GIT1, and miR-149* + siGIT1 plasmids. (B) Cell proliferation was performed by MTT assay. **P<0.01. (C) A Matrigel transwell invasion assay was used to evaluate the invasive ability of MDA-MB-231 cells subjected to different plasmids’ transfection. Representative images of the invasion assays for MDA-MB-231 cells are displayed in the left panel, while statistical histogram is exhibited in the right panel. **P<0.01. (D) A transwell migration assay was applied to evaluate the migrative ability of MDA-MB-231 cells subjected to different plasmids’ transfection. Representative images of the invasion assays for MDA-MB-231 cells are displayed in the left panel, while statistical histogram is exhibited in the right panel. **P<0.01.
Abbreviations: MTT, 3-(4,5-dimethylthiazol-2-yl)-2,5-diphenyltetrazolium bromide; NC, negative control; OD, optical density; qRT-PCR, quantitative reverse transcription-polymerase chain reaction.


