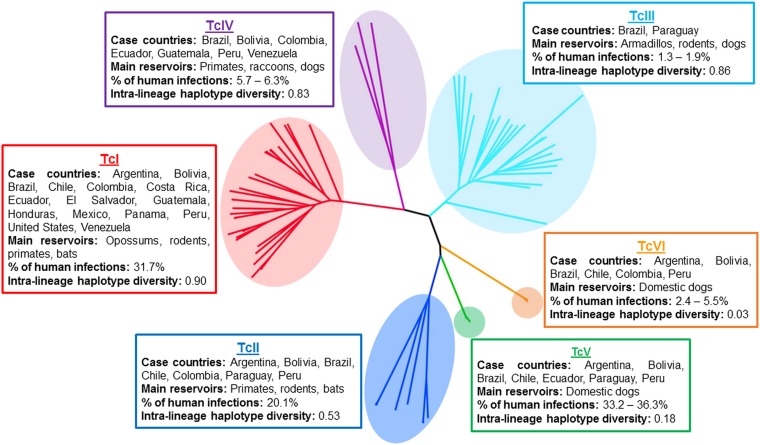
Fig. 1.
Key features of the Trypanosoma cruzi major genetic lineages. The phylogenetic tree was reconstructed using multi-locus microsatellite genotype data, adapted from Lewis et al. (2011). Haplotype diversity is based on mitochondrial gene sequences for COII and ND1 reported in Lewis et al. (2011), and the values shown indicate the probability that two randomly selected haplotypes will be different. The percentage of human infections is estimated from metadata compiled by Brenière et al. (2016), which encompass all isolates derived from human infections (n = 1902) and typed to each lineage. These values may reflect historical variation in sampling intensities between endemic areas.

