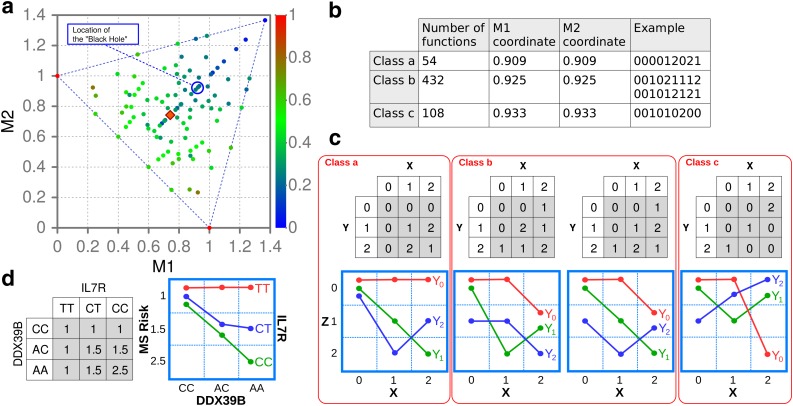
FIG. 15.
There are three function classes very near the convergence point or black hole of information. (a) A blue circle shows the location of the convergence point relative to the function class locations. The orange rhombus indicates the location of the MS genetic interaction defined in panel (d). (b) The table shows the coordinates and the number of functions for the three classes from the blue circle. Classes a and c contain one closed set, whereas class b contains two closed sets. A function example is shown for each closed set. (c) The table representation of four example functions near the black hole (the blue circle) and their gene interaction diagrams. (d) Gene interaction in multiple sclerosis risk (its discretized form) between receptor gene, IL7R, and RNA helicase gene, DDX39B, reported by Galarza-Muñoz et al. (2017), shown as a table and as an interaction diagram. The location of the MS genetic interaction function is indicated by the orange rhombus on the information plane (a). This interaction mode is almost identical to the genetic interaction functions usually termed “Synthetic Lethality” and “Dominant Epistasis.”

