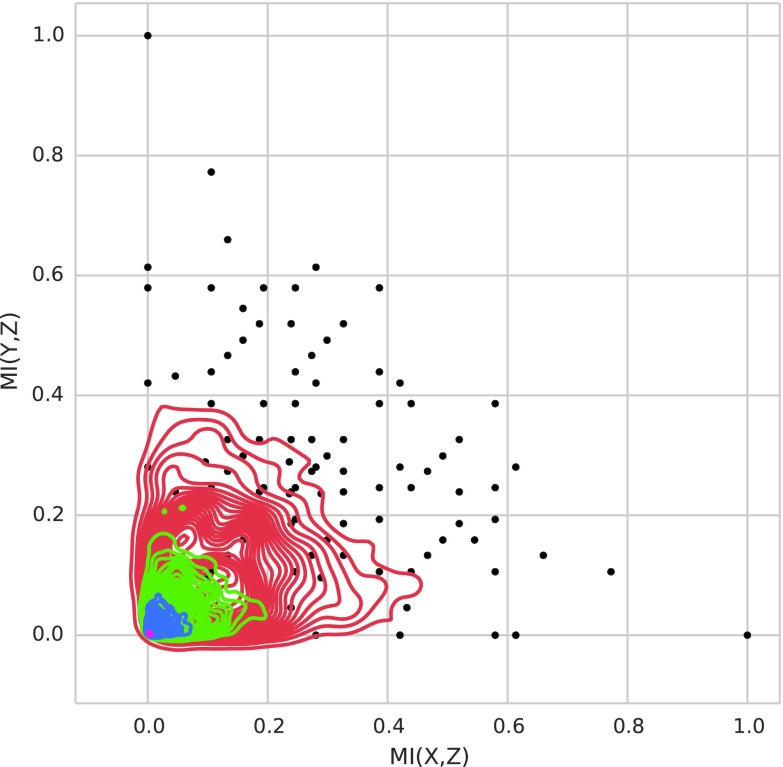
FIG. 18.
Pairwise information landscape with the background noise. We added 1000 random triplets and plot kernel density estimates (colored contours) in the pairwise landscape. To generate a random triplet, we first take all possible combinations of X and Y values (there are nine combinations), duplicate each combination M times (to preserve XY independence), and then draw  random values of Z, one for each pair of XY values. For each random triplet, we computed its mutual information coordinates. We show the distribution of random triplets in the landscape for the sample size N equal to 18 (red), 36 (green), 90 (blue), and 900 (pink). Black dots correspond to the pairwise function classes.

