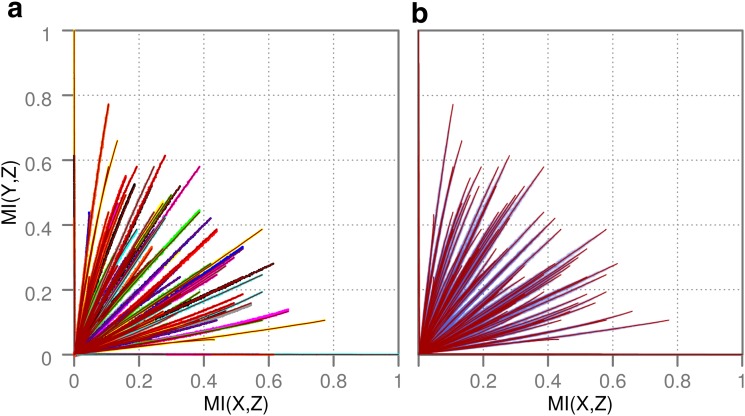
FIG. 20.
Trajectories of function classes in the pairwise landscape as they track the increasing noise. (a) All colored points correspond to the MI coordinates of all function classes in the pairwise landscape. Color is arbitrary and used to better distinguish different function classes. We start with no noise and then gradually increase the level of noise to 100%, each time placing new points representing the shift of the coordinates of the classes due to noise. We kept the color consistent, allowing us to see a trajectory of each class under increasing noise. Each smooth red line corresponds to a Bezier curve fit to all the coordinates of a function class. (b) Only Bezier curve fits for each function class (red) with half standard deviation of noisy coordinates are shown as transparent purple ellipses.

