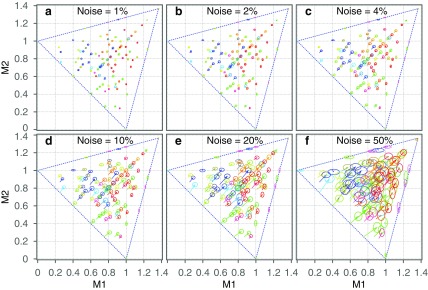
FIG. 21.
Effects of noise on each class in the three-way information landscape. We systematically randomized the generator functions of each class similar to Figure 8 and computed the average and standard deviation of three-way delta coordinates. We show the results for  (900 data points in each data set),
  , and
, and  [shown in panels (a–f) correspondingly]. Each arrow shows the shift of coordinates of a class after adding noise, and the ellipse at the end of each arrow represents the average and standard deviation of delta coordinates of a function with noise.

