
Figure 2.
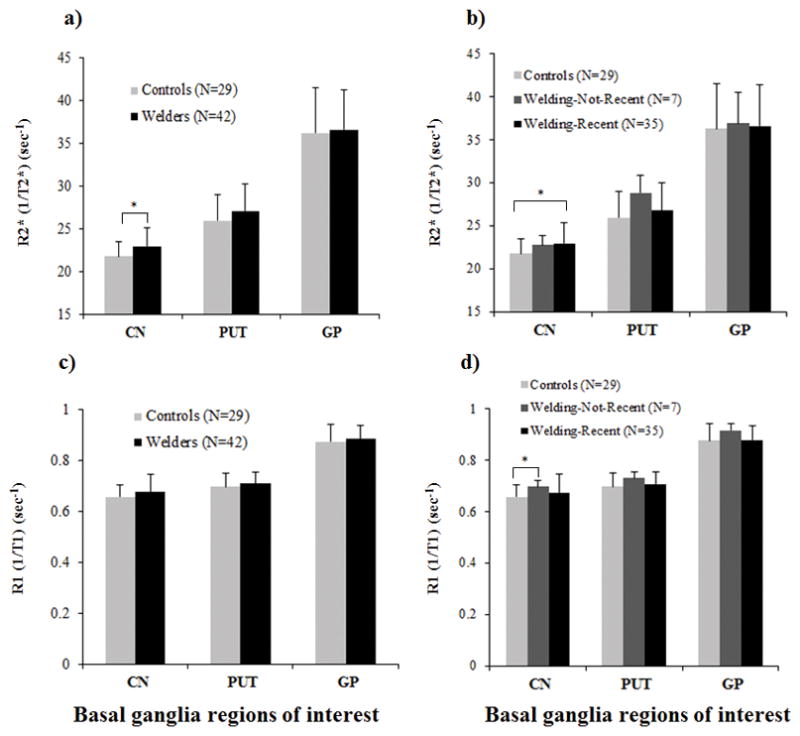
a) MRI apparent transverse relaxation rates (R2*) in basal ganglia regions of interest [caudate nucleus (CN), putamen (PUT), globus pallidus (GP)] for welders and controls, and b) for controls, Welding-Not-Recent, and Welding-Recent subgroups. c) MRI longitudinal relaxation rates (R1) in basal ganglia regions of interest for welders and controls, and d) for controls, Welding-Not-Recent, and Welding-Recent subgroups. Values are raw R2* means ± SD. * indicates significance (p<0.05) after correction for multiple group comparisons using the Benjamin-Hochberg method.