
Figure 4.
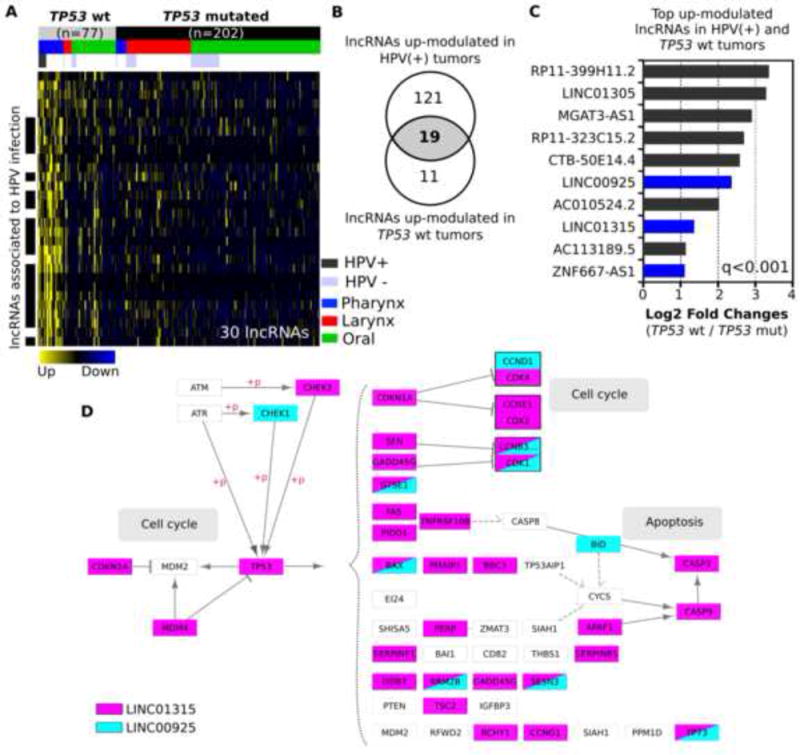
Differential expression analysis based on TP53 mutation status in the HNSCC TCGA.
(A) Heatmap of 42 differentially expressed lncRNAs in comparison between TP53 mutation and TP53 wild type. Sub organ site information (Pharynx: blue, Larynx: red, and Oral: green) and HPV infection status information (HPV+: dark gray, and HPV-: light blue) are included. (B) Venn diagram shows 19 overlapping up-modulated lncRNAs both in HPV+ and TP53 wild type tumors. (C) Representative up-modulated lncRNAs in TP53 wild type tumors are shown in bar chart. LncRNAs whose bars are in blue are significantly enriched in KEGG-P53 signaling pathway. (D) Co-expressed genes with LINC01315 or LINC00925 in KEGG-P53 signaling pathway (LINC01315: pink, and LINC00925: blue).