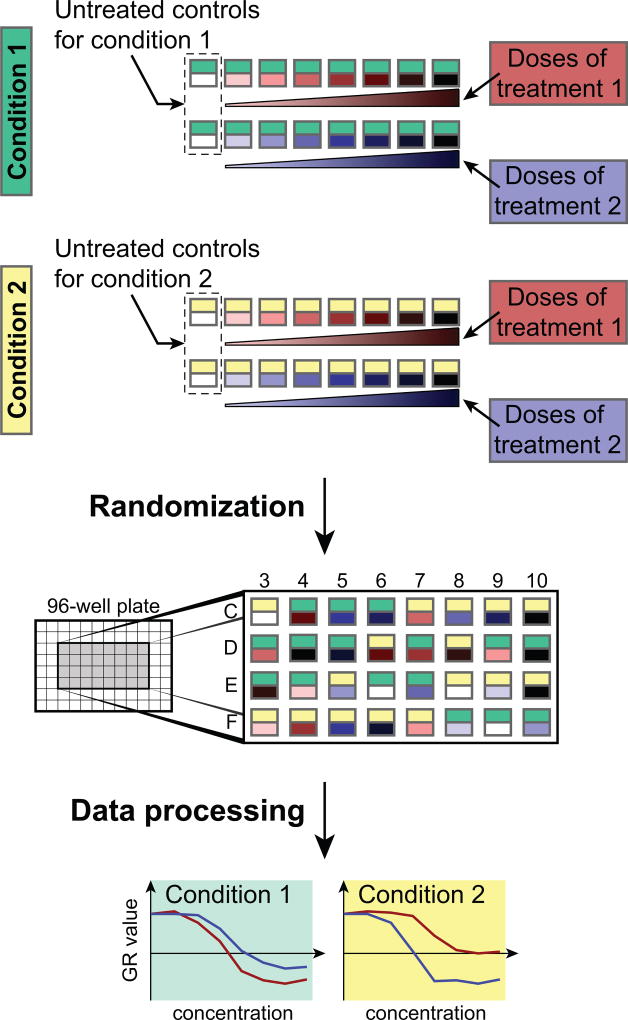
Figure 2. Illustration of an experimental design including different conditions and treatments.
Serial dilutions are measured for two treatments in two different conditions. Provided scripts help to design the treatments and randomize the conditions for avoiding bias during the experiment. Data processing scripts normalize the different treatments to condition-specific untreated controls and yield the dose-response curves. In the “Randomization” panel, for clarity, only the center wells of a 96-well plate are depicted to illustrate the random distribution of experimental conditions across an assay plate.

