
Figure 4. Exemplar Jupyter notebook for the processing the data (protocol 2).
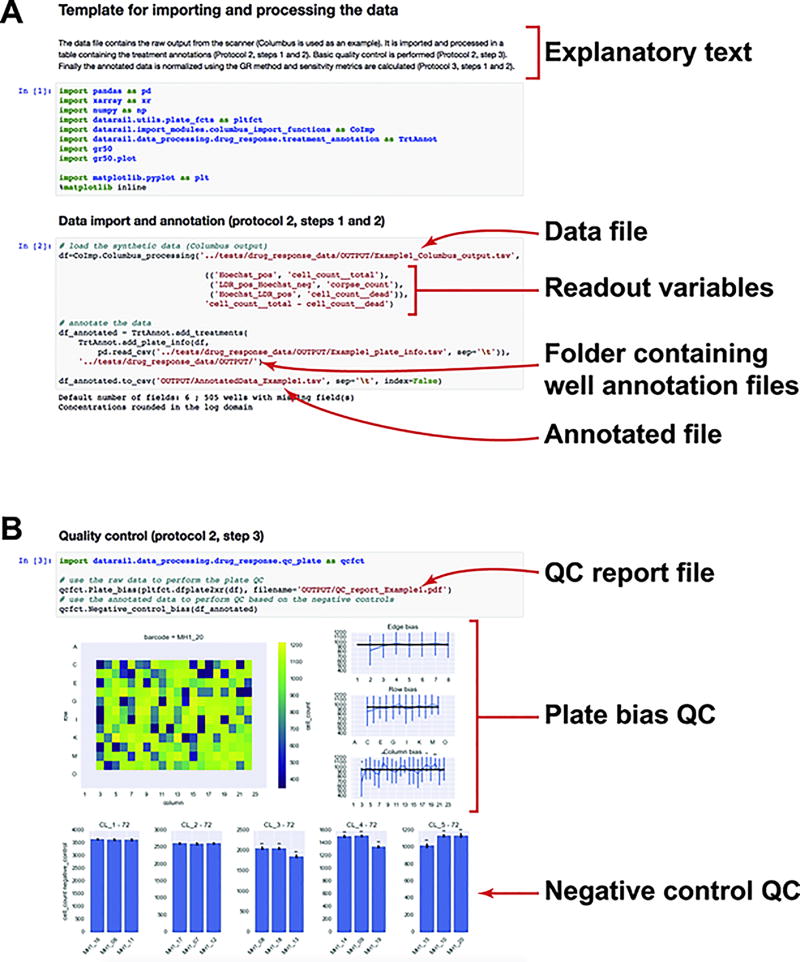
(A) Data outputted by Columbus are imported (protocol 2, step 1) in a pandas dataframe. Function input allows selection of the desired readouts and labels them with a standard name (e.g. cell_count). Data are then merged with the design (protocol 2, step 2).
(B) Different quality controls can be performed on the plate (protocol 2, step 3): bias across the plate can be quantified either by distance from the edge, row, or column; difference in the untreated controls can be quantified across plates to test for bias.