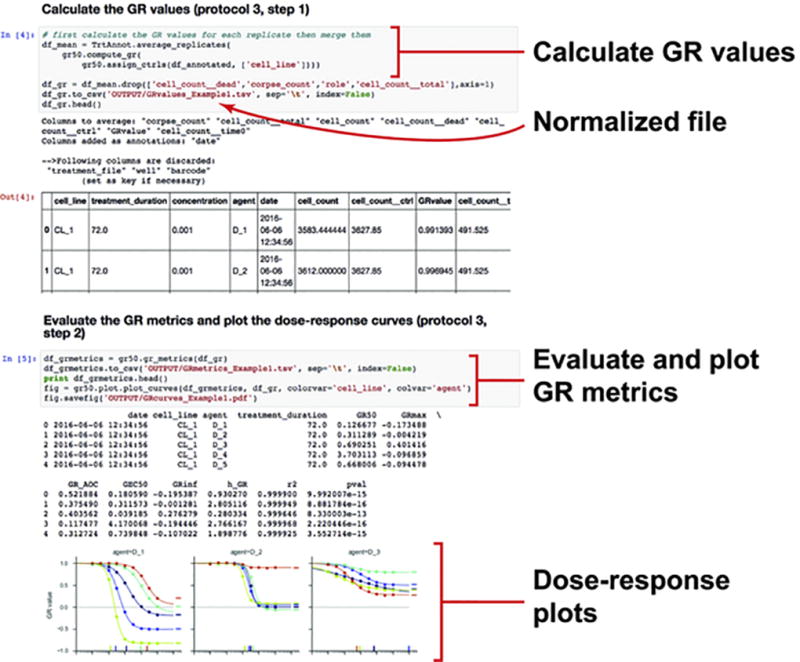
Figure 5. Exemplar Jupyter notebook for evaluating sensitivity metrics (protocol 3).

GR values and metrics are calculated using the gr50_tools module (protocol 3, steps 1 and 2). Dose response curves can be plotted and exported as a pdf file.

GR values and metrics are calculated using the gr50_tools module (protocol 3, steps 1 and 2). Dose response curves can be plotted and exported as a pdf file.