
Figure 5. Exemplar Jupyter notebook for evaluating sensitivity metrics (protocol 3).
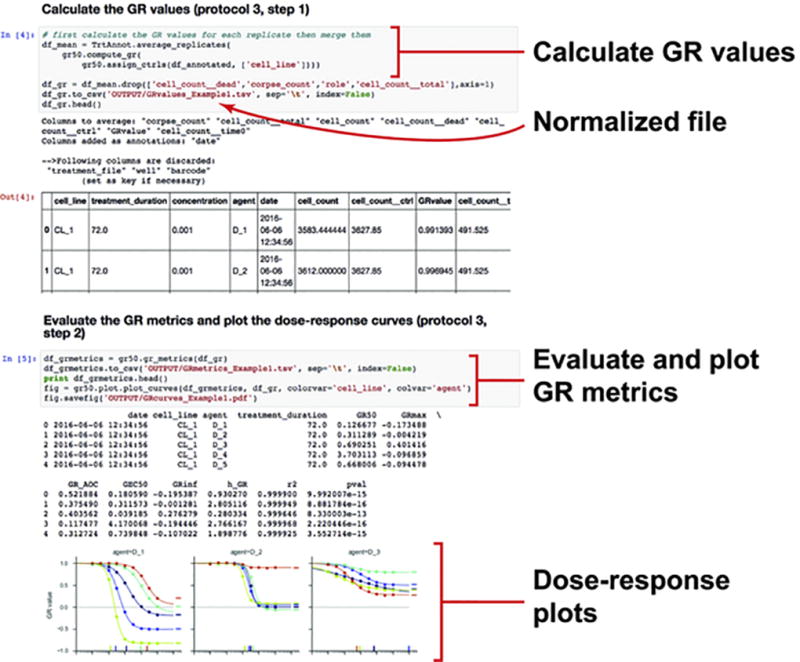
GR values and metrics are calculated using the gr50_tools module (protocol 3, steps 1 and 2). Dose response curves can be plotted and exported as a pdf file.
Official websites use .gov
A
.gov website belongs to an official
government organization in the United States.
Secure .gov websites use HTTPS
A lock (
) or https:// means you've safely
connected to the .gov website. Share sensitive
information only on official, secure websites.
GR values and metrics are calculated using the gr50_tools module (protocol 3, steps 1 and 2). Dose response curves can be plotted and exported as a pdf file.