
Fig. 1.
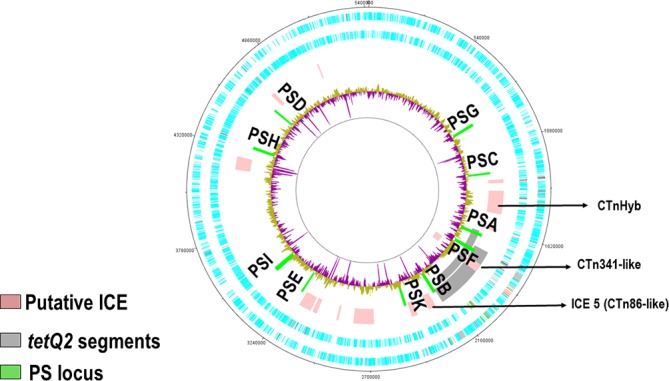
Circular representation of the B. fragilis HMW615 chromosome illustrates the position of tetQ2435, other putative ICEs and polysaccharide (PS) associated loci. From the outside: Circle 1, DNA coordinates; Circle 2 and 3, CDs forward/reverse strands; Circle 4, putative integrative and conjugative elements (ICE) including tetQ2435 (Note: tetQ2435 is marked in this figure as an example of the tetQ2 segment positions); Circle 5, surface polysaccharide synthesis associated loci (PSA-K); Circle 6, graph of %GC content. Above genome average %GC (yellow/green), below average (purple). Note that graph spikes reaching the inner circle relate to %GC sequence assembly gaps.